The Rise and Fall of Syringe Disposal Kiosks in NYC
Methods 1 — Urban Ecologies
In 2017, New York City’s drug crisis was unfurling at an alarming rate. Used syringes littered the ground of public spaces with nearly 5,000 syringes collected every week. Without a place to dispose of the paraphernalia, syringes were left in parks, playgrounds, public restrooms, and even near schools. In response, the city installed 47 syringe disposal kiosks in areas with the highest rates of littered syringes, a measure that would prevent syringe litter from rising while the opioid crisis continued to worsen. By September 2025, only 23 kiosks remain active, leaving hotspots for syringe litter vulnerable to a crisis that has only increased in severity since 2017.
Areas where kiosks were never installed were once thought to have relatively low rates of littered syringes but have since seen a dramatic rise in syringe litter. Particularly at-risk areas where syringe disposal kiosks have been removed can only anticipate a similar fate. It is expected that areas with a syringe kiosk have fewer littered syringes and the removal of kiosks may cause these numbers to rise.
The Bronx and Chinatown are hotspots for littered syringes.
Source: NYC Open Data
In collaboration with the Parks Department, the Department of Health, and OnPoint NYC, 54 syringe disposal kiosks were installed in syringe hotspots in the Bronx. 23 were placed in Manhattan and one was installed in Brooklyn. These disposal kiosks were placed with accessibility in mind, hoping to meet users in areas that demonstrated need. Kiosks are regularly maintained by trained staff to ensure they remain safe and effective.
Syringe kiosk locations installed near hotspots.
Source: NYC Open Data
The most popular syringe disposal kiosk, Kiosk 58, was located just outside of the Bronx in Harlem’s Highland Bridge Park. During its two and a half year lifetime, from 2019 to 2022, it managed to collect a whopping 31,793 syringes, preventing the disposed syringes from becoming a hazard on the ground. After Kiosk 58 broke, it was removed and despite its proven success, another kiosk was not reinstalled.
Many of the most successful kiosks in the Bronx have been removed.
Source: NYC Open Data
The most popular syringe disposal kiosk, Kiosk 58, was located just outside of the Bronx in Harlem’s Highland Bridge Park. During its two and a half year lifetime, from 2019 to 2022, it managed to collect a whopping 31,793 syringes, preventing the disposed syringes from becoming a hazard on the ground. After Kiosk 58 broke, it was removed and despite its proven success, another kiosk was not reinstalled.
In 2018, sites with low syringe litter didn’t recieve kiosks. Syringe litter spiked as result.
Source: NYC Open Data
Littered syringes recorded for areas that haven’t received syringe disposal kiosk were relatively low at the start of the City’s kiosk initiative in 2017. Because they did not represent elevated rates of syringe litter, they may have not been considered vulnerable and in need of kiosks. In 2021, syringe counts for areas without a kiosk took a turn for the worst with a dramatic increase in syringe rates. Despite its initially low ground syringe count, numbers skyrocketed to 17,686 syringes collected from the ground during the month of October in 2024, far more than its counterparts that received kiosks as a result of demonstrated vulnerability.
Sites with high syringe litter received kiosks. Syringe litter remained low compared to sites without syringe kiosks.
Source: NYC Open Data
Areas with a syringe kiosk showed high rates of littered syringes from 2018 to 2021 compared to those that did not receive kiosks, marking these sites as recipients for the syringe disposal kiosk. As the years progress, the numbers do not steadily increase, instead they spike shortly from 2021 to 2022 during the COVID-19 Pandemic and then fall to rates less than half of their kioskless counterparts.
Syringe disposal kiosks have proven to be effective at reducing syringe litter. Further steps towards making a syringe-free city include installing more syringe disposal kiosks in areas with demonstrated risk. Even with their demonstrated success, there are less syringe disposal kiosks now than when the initiative began in 2018. Twelve kiosks were removed due to construction, raising speculation on whether they will be reinstalled. Seven disposal kiosks were removed due to their proximity to a playground or a school, sparking concern whether syringe rates will increase in areas with children at play or if removing the kiosk entirely is the safest option.
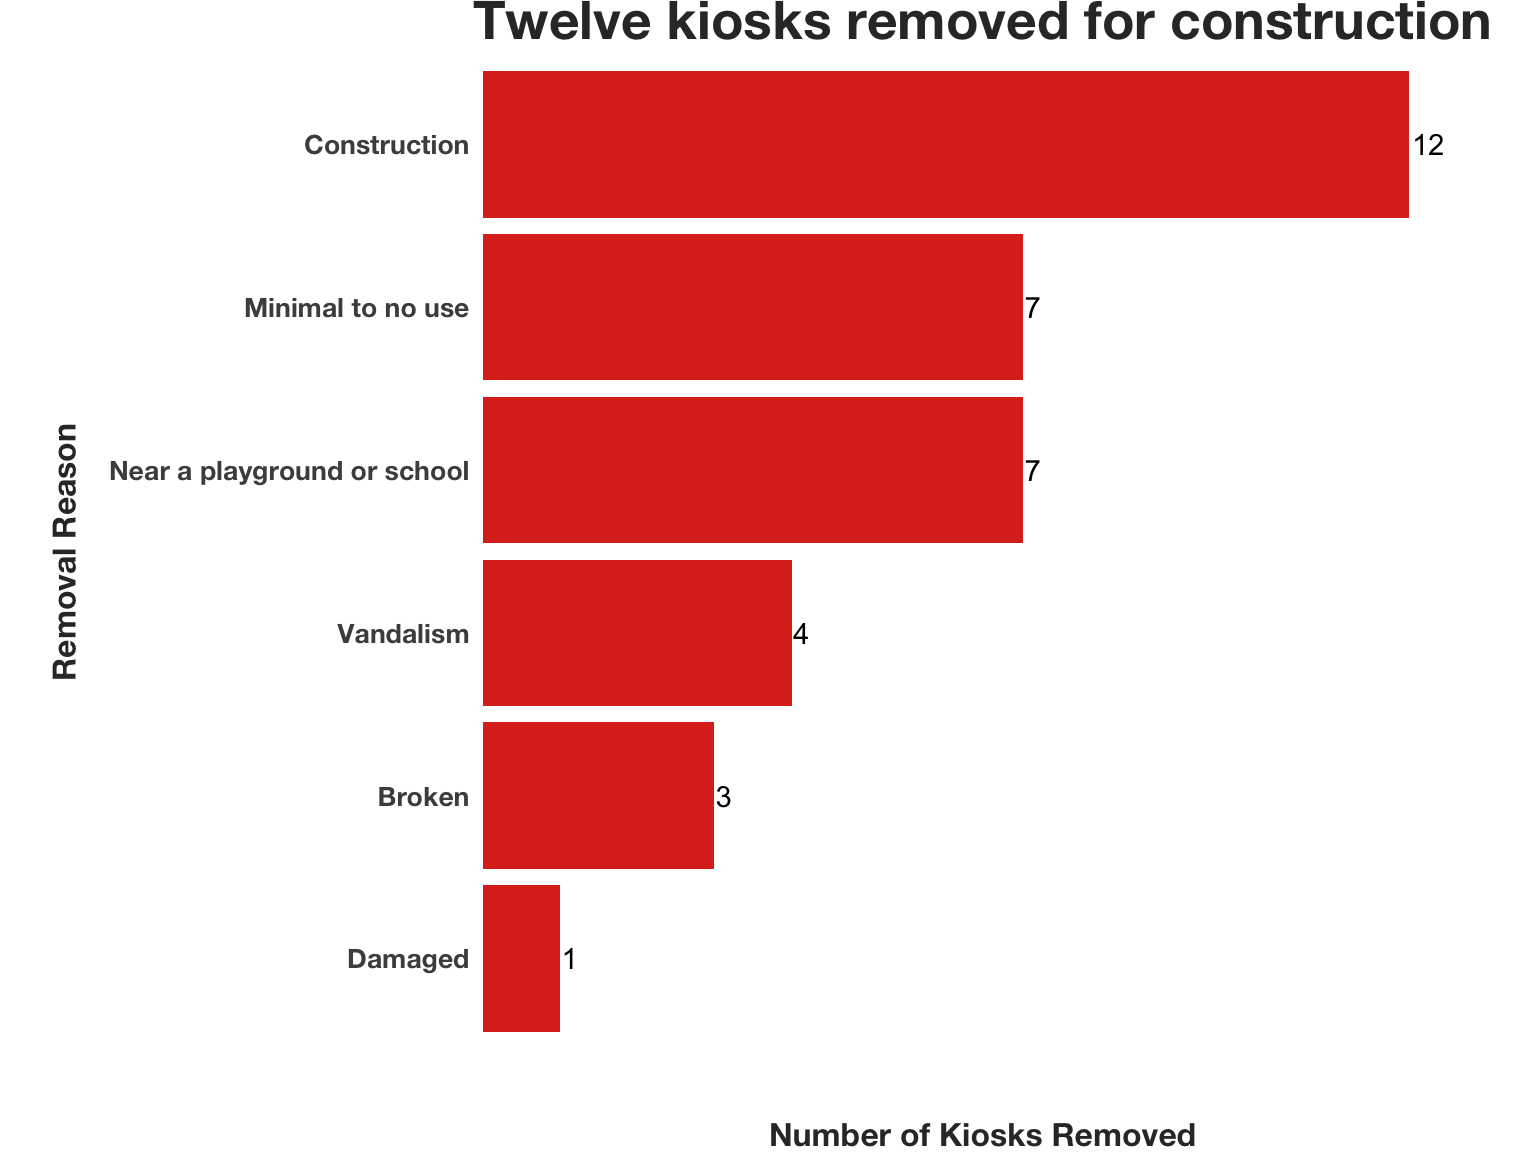
Source: NYC Open Data Note: Categories combined for clarity.
NYC’s harm reduction efforts are proven to keep public spaces safe. As public drug usage continues to be a daily struggle for the city, reimplementing and installing new syringe disposal kiosks may be the key to combat increasing rates of littered syringes.
Data Methodology
Methods for kiosk locations map
Code
library(jsonlite)
library(tmap)
library(scales)
library(tidyverse)
library(sf)         # spatial data frames & operations
library(leaflet)  #interactive map
library(leaflet.extras2)
library(leaflet.extras) #for heatmapping
library(forcats)
library(mapview)
library(ggplot2)
library(plotly)
library(RColorBrewer)
library(dplyr)
library(lubridate)
library(cowplot)
library(packcircles)

#Read in CSV
syringe_data <- "/Users/mayafuentes/Desktop/Urban_Ecologies/syringe/data/Summary_of_Syringe_Data_in_NYC_Parks_20251121.csv"

#Convert to R df
syringe_data_tbl <- utils::read.csv(
  syringe_data,
  check.names = FALSE,     # keep original column names
  stringsAsFactors = FALSE # keep text as character
)

#Repair empty column names
if (any(!nzchar(names(syringe_data_tbl)))) {
  empty_idx <- which(!nzchar(names(permits_tbl)))
  names(permits_tbl)[empty_idx] <- paste0("unnamed_col_", empty_idx)
}

#Filter for rows with kiosk number. This will be used to map syringes in kiosks.
syringe_data_kiosks <- syringe_data_tbl %>% filter(!is.na(kiosk_number))
syringe_data_kiosks

#Filter for rows without kiosk number. This will be used to map syringes on the ground.
syringe_data_ground <- syringe_data_tbl %>% filter(is.na(kiosk_number) | kiosk_number == "")
syringe_data_ground

#Read in dataset on kiosks.
kiosk_data<-"/Users/mayafuentes/Desktop/Urban_Ecologies/syringe/data/Parks_Syringe_Disposal_Kiosks_20251121.csv"
# --- Read CSV (base utils to avoid vroom/readr path issues) ---
kiosk_data_tbl <- utils::read.csv(
  kiosk_data,
  check.names = FALSE,     # keep original column names like "Bin"
  stringsAsFactors = FALSE # keep text as character
)

#Repair empty column names.
if (any(!nzchar(names(kiosk_data_tbl)))) {
  empty_idx <- which(!nzchar(names(permits_tbl)))
  names(permits_tbl)[empty_idx] <- paste0("unnamed_col_", empty_idx)
}

#Clean coordinates so they are just points without spaces, symbols, or words.
kiosk_data_tbl <- kiosk_data_tbl %>%
  mutate(Point_clean_2 = str_remove_all(Point, "POINT \\(|\\)")) %>%
  mutate(Point_clean_2 = str_squish(Point_clean_2)) %>%

#Separate coordinates into x and y.
  separate(Point_clean_2, into = c("x", "y"), sep = " ", convert = TRUE)

#Drop n/a values
kiosk_data_tbl <- kiosk_data_tbl %>%
  dplyr::filter(!is.na(x) & !is.na(y))

#Convert df to sf, a spatial data frame.
kiosk_sf <- st_as_sf(kiosk_data_tbl, coords = c('x', 'y'))
kiosk_sf <- st_set_crs(kiosk_sf, 4326) #Set CRS

kiosk_sf <- kiosk_sf %>%
  mutate(
    x = st_coordinates(.)[,1],  #Make x longitude
    y = st_coordinates(.)[,2]   #Make y latitude
  )
Methods for proportional symbol map
Code
#Proportional symbol map of most used kiosks with kiosk status

#Pair Kiosk Number in Syringe Data to Kiosk ID from kiosk data and join point coordinates in Kiosk Data
#Add Kiosk ID column + Point to syringe_data_kiosks
syringe_data_kiosks <- syringe_data_kiosks %>%
  left_join(
    kiosk_data_tbl %>% select(KioskID, Point),
    by = c("kiosk_number" = "KioskID"),
  )

#Clean coordinates so they are just points without spaces, symbols, or words.
syringe_data_kiosks <- syringe_data_kiosks %>%
  mutate(Point_clean = str_remove_all(Point, "POINT \\(|\\)")) %>%
  mutate(Point_clean = str_squish(Point_clean)) %>%

#Separate coords into x, y.
  separate(Point_clean, into = c("x", "y"), sep = " ", convert = TRUE)

#Drop n/a values
syringe_data_kiosks <- syringe_data_kiosks %>%
  dplyr::filter(!is.na(x) & !is.na(y))


#Convert to sf object
syringe_sf <- st_as_sf(syringe_data_kiosks, coords = c('x', 'y'))
syringe_sf <- st_set_crs(syringe_sf, 4326)

#Convert kiosk counts into circle radii for proportional symbol map
radius_scale <- function(val, minRadius = 5, maxRadius = 15) {
  scaled <- (val - min(val)) / (max(val) - min(val))  # normalize 0–1
  scaled * (maxRadius - minRadius) + minRadius
}

# Aggregate kiosk_syringes by kiosk_number, keeping coordinates
kiosk_summary <- syringe_data_kiosks %>%
  filter(!is.na(kiosk_number)) %>%  #only include rows with a kiosk_number
  group_by(kiosk_number, x, y) %>%  #group by kiosk and coordinates
  summarise(
    kiosk_syringes = sum(kiosk_syringes, na.rm = TRUE),
    .groups = "drop"
  )

kiosk_summary <- kiosk_summary %>%
  left_join(
    kiosk_data_tbl %>% select(KioskID, Status, ContainerSize, InstallationDate, `Remove Date`, `Removal Reason`, Borough),
    by = c("kiosk_number" = "KioskID"),
  )

#kiosk_summary_new <- kiosk_summary[-c(36, 37, 38), ]


#Check result
#view(kiosk_summary)

#Set radius scale for points
radius_scale <- function(val, minRadius = 3, maxRadius = 40) {
  scaled <- (val - min(val, na.rm = TRUE)) / (max(val, na.rm = TRUE) - min(val, na.rm = TRUE))
  scaled * (maxRadius - minRadius) + minRadius
}
Methods for heatmap
Code
#Read in parks data
prop_num <- st_read("/Users/mayafuentes/Desktop/Urban_Ecologies/syringe/data/Parks_Properties.geojson")

#Change multipolygon to centroid
prop_num_sf <- st_as_sf(prop_num, wkt = "geometry", crs = 4326)

#Make invalid points valid
prop_num_sf <- st_make_valid(prop_num_sf)

prop_num_sf <- prop_num_sf %>%
  mutate(centroid = st_centroid(geometry))

#Separate x & y coordinates
prop_num_sf <- prop_num_sf %>%
  mutate(
    x = st_coordinates(centroid)[,1],
    y = st_coordinates(centroid)[,2]
  )


#Join ground syringe data with coordinates for each GIS property number
syringe_data_ground <- syringe_data_ground %>%
  left_join(prop_num_sf %>% select(gispropnum,x, y), by = "gispropnum")

syringe_data_ground <- syringe_data_ground[syringe_data_ground$ground_syringes != "", ] #Remove blanks
syringe_data_ground$ground_syringes<- as.numeric(syringe_data_ground$ground_syringes)  #Convert ground syringe count to numeric

#Add syringe count at the same location
syringe_ground_summary <- syringe_data_ground %>%
  group_by(gispropnum, x, y) %>%   #Group by unique location
  summarize(
    ground_syringes = sum(ground_syringes, na.rm = TRUE),  #Sum all syringes at that location
    kiosk_site = first(kiosk_site),          #Keep other columns
    property_type = first(property_type),
    location = first(location),
    date=first(collected_date),
    borough=first(borough)
  ) %>%
  ungroup()

#Heatmap
syringe_ground_summary_clean <- syringe_ground_summary %>%
  filter(
    !is.na(ground_syringes),  # remove invalid intensities
    !is.na(x),                 # remove missing longitude
    !is.na(y)                  # remove missing latitude
  )

#Set x & y and CRS
syringe_ground_summary_clean %>%
  mapview(xcol = "x", ycol = "y", crs = 4326, grid = FALSE, map.types = "OpenStreetMap")


#heatmap color palette (color blind friendly)
my_colors <- colorRampPalette(c("#32338a", "#19a898", "#ffeb0f", "red"))(256)
Methods for ground syringes by kiosk with bar chart
Code
#Ground syringes bar chart at locations with and without kiosks

#Convert date & make site column logical instead of string
syringe_data_ground <- syringe_data_ground %>%
  mutate(
    collected_date = as.POSIXct(
      collected_date,
      format = "%Y %b %d %I:%M:%S %p"
    ),
    kiosk_site = tolower(kiosk_site),    #Force lowercase
    kiosk_site = kiosk_site == "true"    #Final logical TRUE/FALSE
  )

table(syringe_data_ground$kiosk_site)  #Check

#Create kiosk_site=true data set from 2018 to 2024
syringe_data_ground_filtered_true <- syringe_data_ground %>%
  mutate(
    year = year(collected_date),
    month = floor_date(collected_date, "month")
  ) %>%
  filter(
    kiosk_site == TRUE,
    year >= 2018,
    year <= 2024
  )

monthly_counts_true <- syringe_data_ground_filtered_true %>%
  group_by(month) %>%
  summarize(total_ground = sum(ground_syringes, na.rm = TRUE)) %>%
  ungroup()

#Create kiosk_site=false data set from 2018 to 2024
syringe_data_ground_filtered_false <- syringe_data_ground %>%
  mutate(
    year = year(collected_date),
    month = floor_date(collected_date, "month")
  ) %>%
  filter(
    kiosk_site == FALSE,
    year >= 2018,
    year <= 2024
  )

#Make bars by month
monthly_counts_false <- syringe_data_ground_filtered_false %>%
  group_by(month) %>%
  summarize(total_ground = sum(ground_syringes, na.rm = TRUE)) %>%
  ungroup()

#Make y-axis the same for both charts based on max count
y_max <- max(
  c(monthly_counts_true$total_ground, monthly_counts_false$total_ground),
  na.rm = TRUE
)
Methods for line chart
Code
#Convert install and remove character to dates
kiosk_install <- kiosk_summary%>%
  mutate(
    InstallationDate = as.POSIXct(
      InstallationDate,
      format = "%Y %b %d %I:%M:%S %p"),
      `Remove Date` = as.POSIXct(
        `Remove Date`,
        format = "%Y %b %d %I:%M:%S %p"
    ))

#Create count column for each new or removed kiosk
events <- kiosk_install %>%
  select(kiosk_number, Borough, InstallationDate, `Remove Date`) %>%
  pivot_longer(
    cols = c(InstallationDate, `Remove Date`),
    names_to = "event_type",
    values_to = "date"
  ) %>%
  filter(!is.na(date)) %>%
  mutate(
    change = case_when(
      event_type == "InstallationDate"  ~  1,
      event_type == "Remove Date" ~ -1
    )
  )

#Group by month
monthly_counts <- events %>%
  mutate(month = floor_date(date, "month")) %>%  # round to first of the month
  group_by(month) %>%
  filter(month >= as.Date("2016-01-01"))%>%
  summarise(net_change = sum(change), .groups = "drop")

#Analyze change by month
active_over_time_monthly <- monthly_counts %>%
  arrange( month) %>%
  mutate(active_stations = cumsum(net_change)) %>%
  ungroup()
Methods for bar chart by removal
Code
#Combine bars for school and playground and low and non use
#Filter out blanks and "removed" variable that tells us nothing
removal_sum <- kiosk_summary %>%
  mutate(
    RemovalReason_combined = case_when(
      `Removal Reason` %in% c(
        "Restrooms near playground",
        "Restroom in playground",
        "Restrooms used by playground, school"
      ) ~ "Near a playground or school",
      `Removal Reason` %in% c("Non use", "Low usage") ~ "Minimal to no use",
      TRUE ~ `Removal Reason`
    )
  ) %>%
  filter(
    RemovalReason_combined != "",
    RemovalReason_combined != "Removed"
  ) %>%
  mutate(
    RemovalReason_combined = fct_rev(fct_infreq(RemovalReason_combined))
  )
Limitations:
New York City has provided thorough data on syringe collection, nonetheless limitations to the project still persist. According to The Syringe Summary dataset, “The Syringe Summary dataset contains records for syringes collected by both Parks staff as well as collection efforts by the Washington Heights Corner Project.” Because only syringes collected by staff and volunteers are recorded, a number of syringes may not be documented, specifically in areas that are seeing less frequent maintenance efforts. Because the dataset focuses on public spaces like parks and playgrounds, it does not address less centralized locations like sidewalks or stoops, where syringes may still be present and dangerous to the public.
Datasets:
Summary of Syringe Data in NYC Parks Accessed November 21, 2025. CSV. From 2016 to present, updated for new events.
Parks Syringe Disposal Kiosks Accessed November 21, 2025. CSV. From 2016 to present, updated for new events.
Parks Properties Accessed December 5, 2025. GeoJSON.